Data Introduction
First we need to take a look at all the variables. The dataset contains 21 variables, and the description of the variables is shown below:
| Variable | Type | Description |
|---|---|---|
customerID |
String | Unique customer identifier |
gender |
String | Customer gender (Male, Female) |
seniorCitizen |
Double | Indicates if customer is a senior (1 = Yes, 0 = No) |
partner |
String | Whether the customer has a partner (Yes, No) |
dependents |
String | Whether the customer has dependents (Yes, No) |
tenure |
Double | Number of months the customer has been with the company |
phoneService |
String | Whether customer has phone service |
multipleLines |
String | Whether customer has multiple phone lines |
internetService |
String | Type of internet service (DSL, Fiber optic, No) |
onlineSecurity |
String | Whether customer has online security service |
onlineBackup |
String | Whether customer has online backup service |
deviceProtection |
String | Whether customer has device protection |
techSupport |
String | Whether customer has tech support service |
streamingTV |
String | Whether customer streams TV |
streamingMovies |
String | Whether customer streams movies |
contract |
String | Contract type (Month-to-month, One year, Two year) |
paperlessBilling |
String | Whether customer uses paperless billing |
paymentMethod |
String | Payment method used by the customer |
monthlyCharges |
Double | Monthly billing amount |
totalCharges |
Double | Total amount charged to the customer |
churn |
Double | Whether the customer has churned (1 = Yes, 0 = No) |
Here churn means the customer has churned, which is the target variable we need to predict. And variable tenure means the number of months the customer has been with the company, which is the time variable we need to use in the survival analysis. Most of other variables are categorical variables, which facilitate the use of models like cox model.
Step 1: Data Loading and Preprocessing
Method:
The dataset was loaded using Spark. Schema was defined for all columns. The target population includes customers with “Month-to-month” contracts and active internet service.
Processing:
churnStringwas binarized into a numericchurncolumn.- Only “Month-to-month” internet users were selected to focus on high churn-risk users.
- Only users with
internetServicenot equal to “No” were retained.
Result:
The first 5 rows of the dataset is shown below: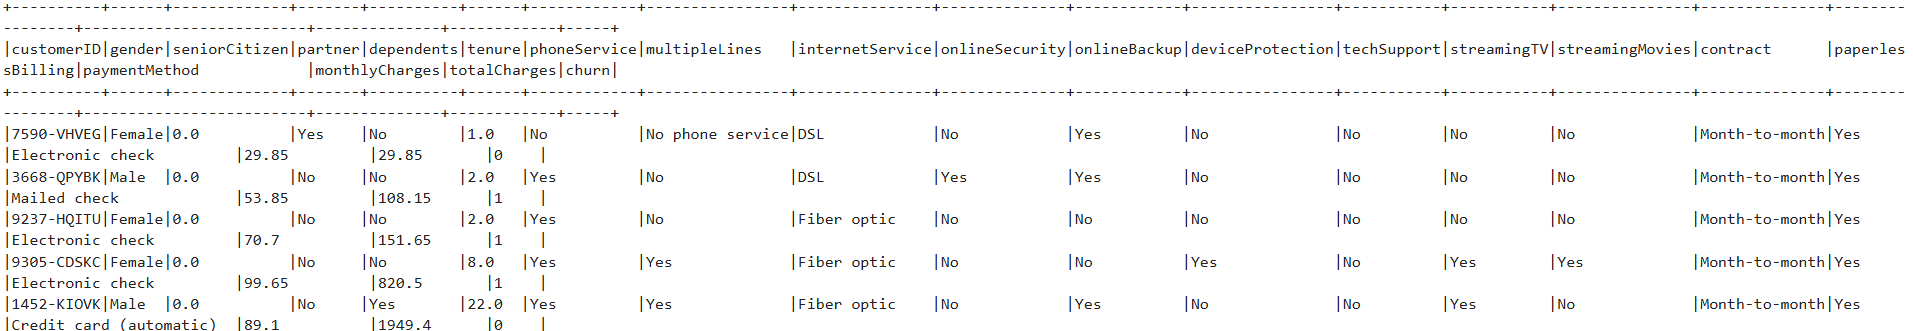
Step 2: Kaplan-Meier Estimation
Method:
A Kaplan-Meier estimator was used to measure the probability of customer retention over time.
Variables:
- T:
tenure(duration until event or censoring) - C:
churn(1 if churned, 0 if censored)
Result:
The KM survival curve is shown below: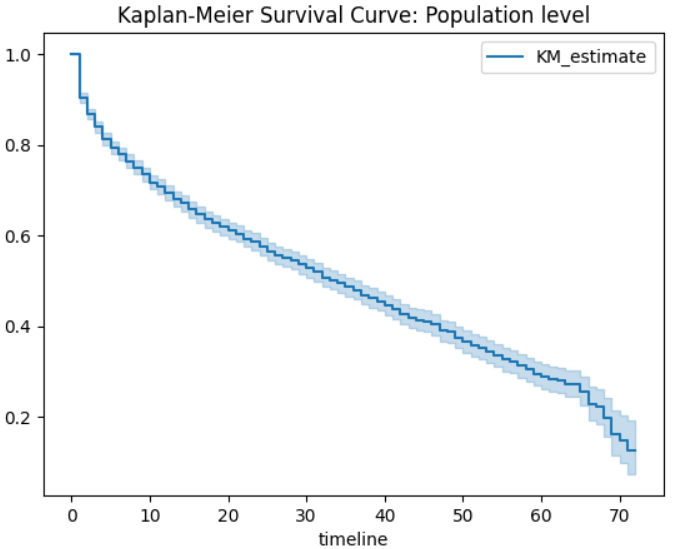
Stratified KM curves were plotted for each categorical variable, the survival curves are shown below: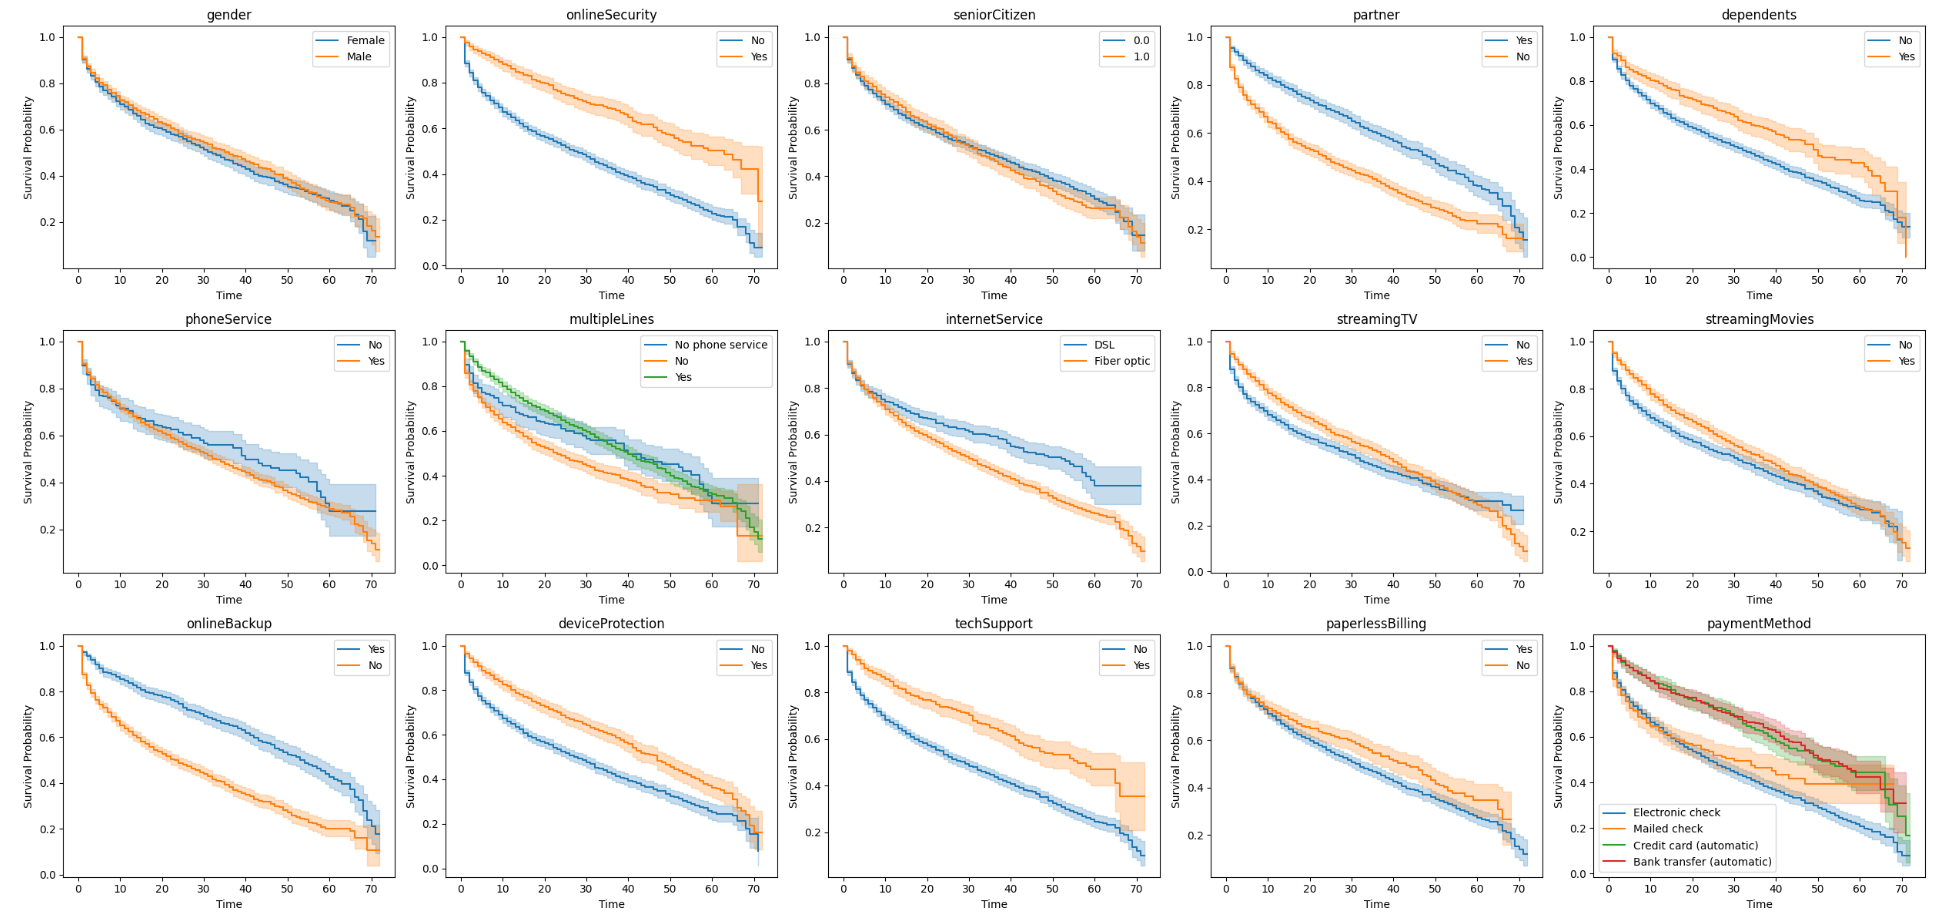
Log-Rank Tests:
- Statistically significant differences in survival curves were found for multiple covariates, including
onlineSecurity(p-value: $3.14\times{10}^{-18}$)seniorCitizen(p-value: $2.52\times{10}^{-12}$)partner(p-value: $5.06\times{10}^{-58}$)dependents(p-value: $2.51\times{10}^{-4}$)internetService(p-value: $2.37\times{10}^{-32}$)streamingTV(p-value: $1.81\times{10}^{-32}$)streamingMovies(p-value: $6.48\times{10}^{-39}$)onlineBackup(p-value: $2.62\times{10}^{-67}$)deviceProtection(p-value: $7.90\times{10}^{-39}$)techSupport(p-value: $3.46\times{10}^{-7}$)paperlessBilling(p-value: $5.00\times{10}^{-7}$)paymentMethod
Findings:
- The median survival time was estimated at approximately 34 months.
- The survival curve showed a steep early decline, indicating significant churn within the first year.
- According to Stratified KM curves and Log-Rank tests, the following features were found to be significant in affecting customer retention:
onlineSecurity: Customers with online security had a higher survival probability.partner: Customers with partners had a higher survival probability.dependents: Customers with dependents had a higher survival probability.internetService: Fiber-optic users had a higher survival probability compared to DSL users.onlineBackup: Customers with online backup services had a higher survival probability.deviceProtection: Customers with device protection had a higher survival probability.techSupport: Customers with tech support had a higher survival probability.
Step 3: Cox Proportional Hazards (PH) Model
Method:
The Cox PH model was fitted to evaluate the hazard ratio associated with multiple covariates without assuming a parametric form for the baseline hazard.
Covariates:
One-hot encoding was applied to:
dependentsinternetServiceonlineBackuptechSupportpaperlessBilling
Model Summary Raw Result: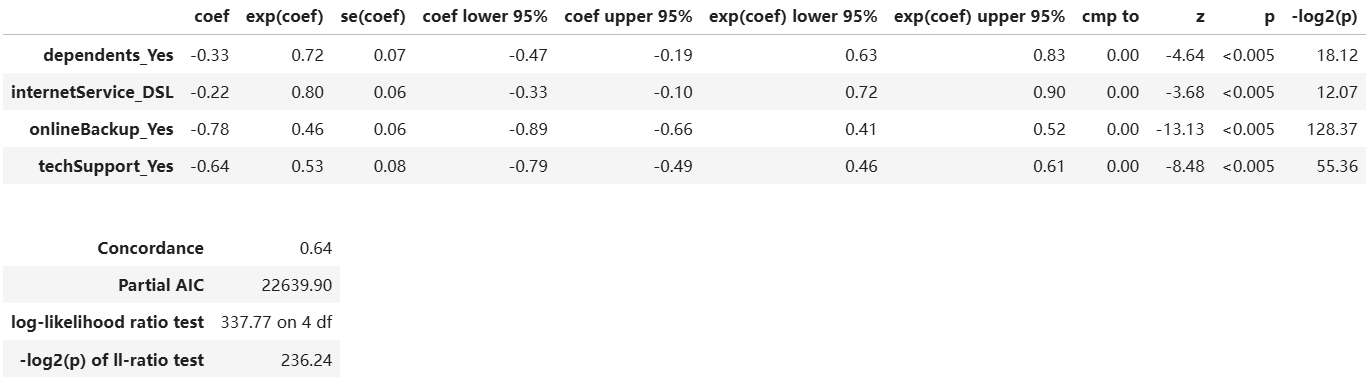
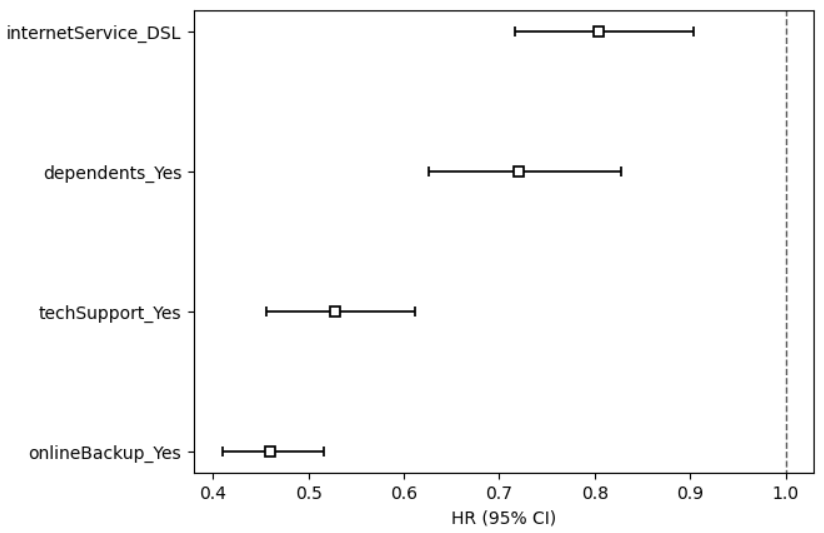
Model Summary:
| Variable | Hazard Ratio | p-value | Interpretation |
|---|---|---|---|
dependents_Yes |
0.72 < 1 | < 0.005 | Associated with reduced risk of churn |
internetService_DSL |
0.80 < 1 | < 0.005 | Lower churn hazard compared to fiber users |
onlineBackup_Yes |
0.46 < 1 | < 0.005 | Reduced churn hazard |
techSupport_Yes |
0.53 < 1 | < 0.005 | Associated with reduced risk of churn |
PH Assumption Checks:
- Scaled Schoenfeld residuals were plotted against time to check for proportional hazards assumption.
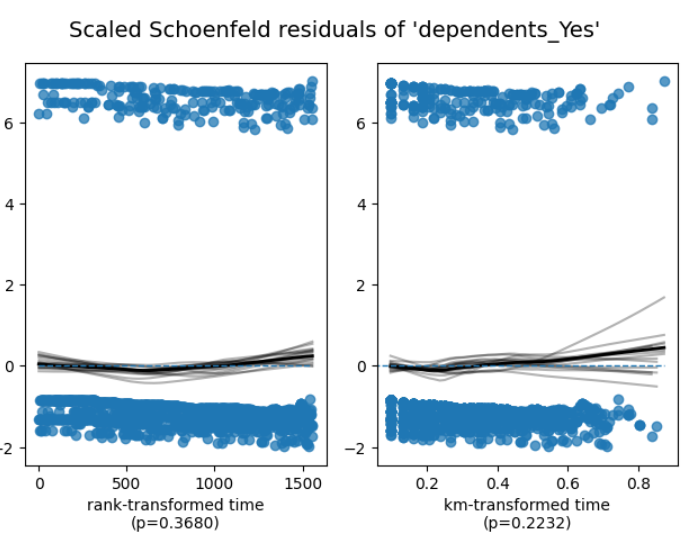
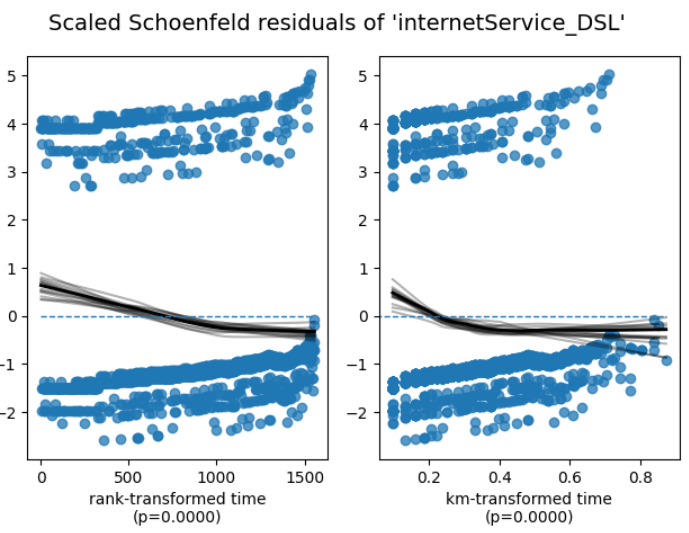
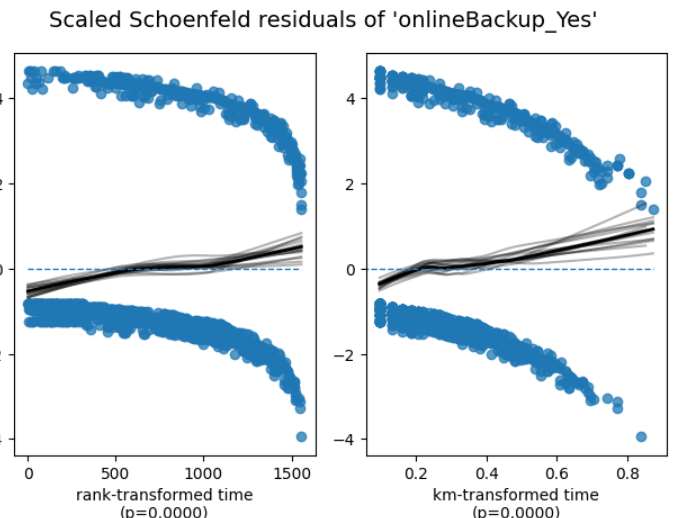
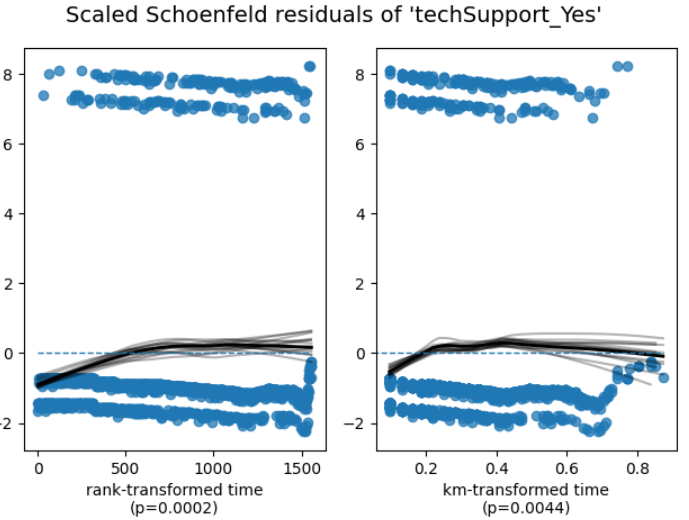
According to the Schoenfeld residuals, only the plot of the variable dependents is horizontal, which means the variable dependents is proportional.
Statistical Test Result
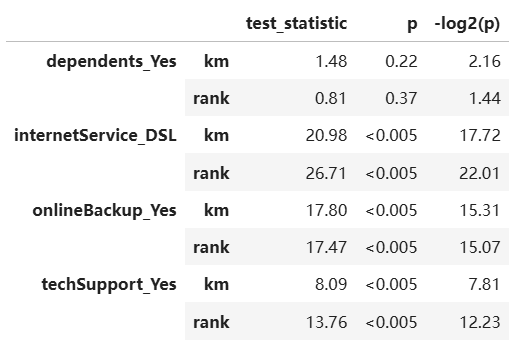
The result is the same as using Schoenfeld residuals, which means the variable
dependentsis proportional.log-log plots
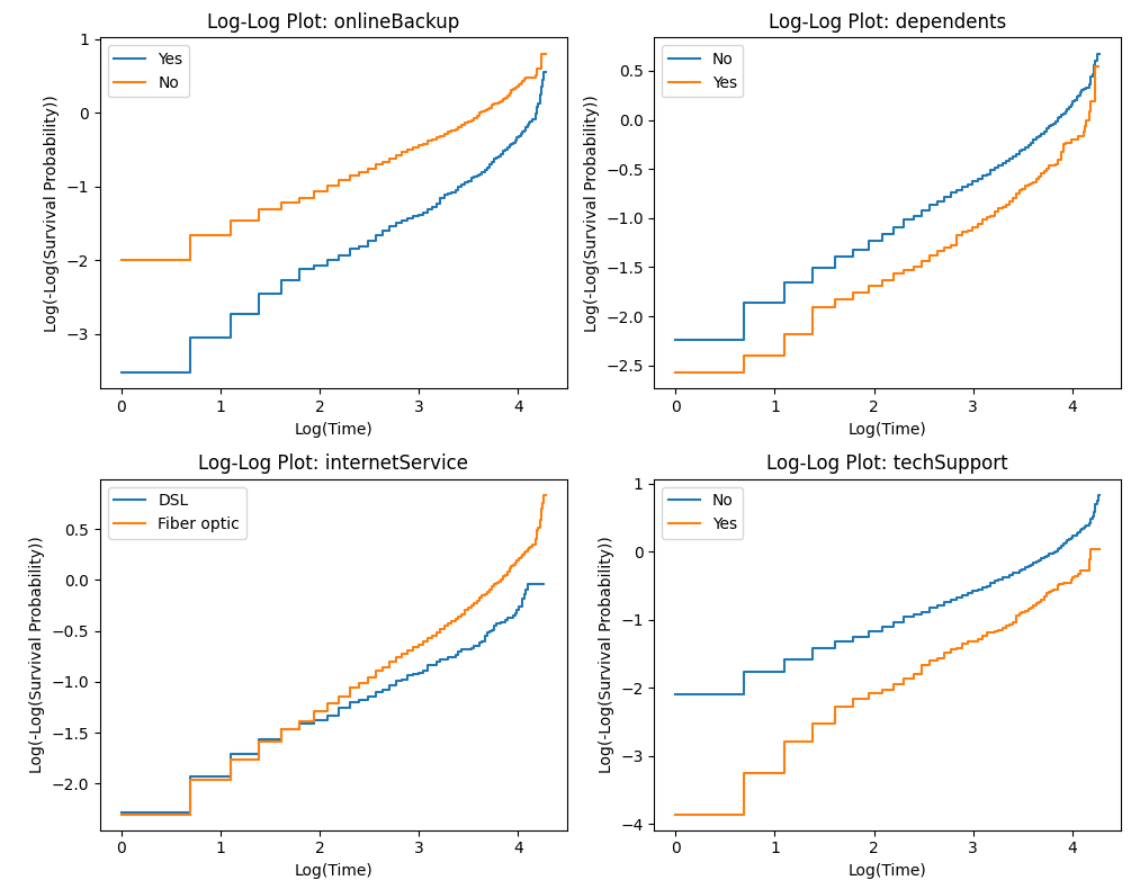
According to the log-log plots, the plots of the variable
dependentsandtechSupportare nearly parallel, which means the variabledependentsandtechSupportare proportional.
Step 4: Accelerated Failure Time (AFT) Model
Method:
A log-logistic AFT model was fitted to directly model survival time as a function of covariates.
Variables:
One-hot encoding was applied to:
partnermultipleLinesinternetServiceonlineSecurityonlineBackupdeviceProtectiontechSupportpaymentMethod
Model Summary Raw Result: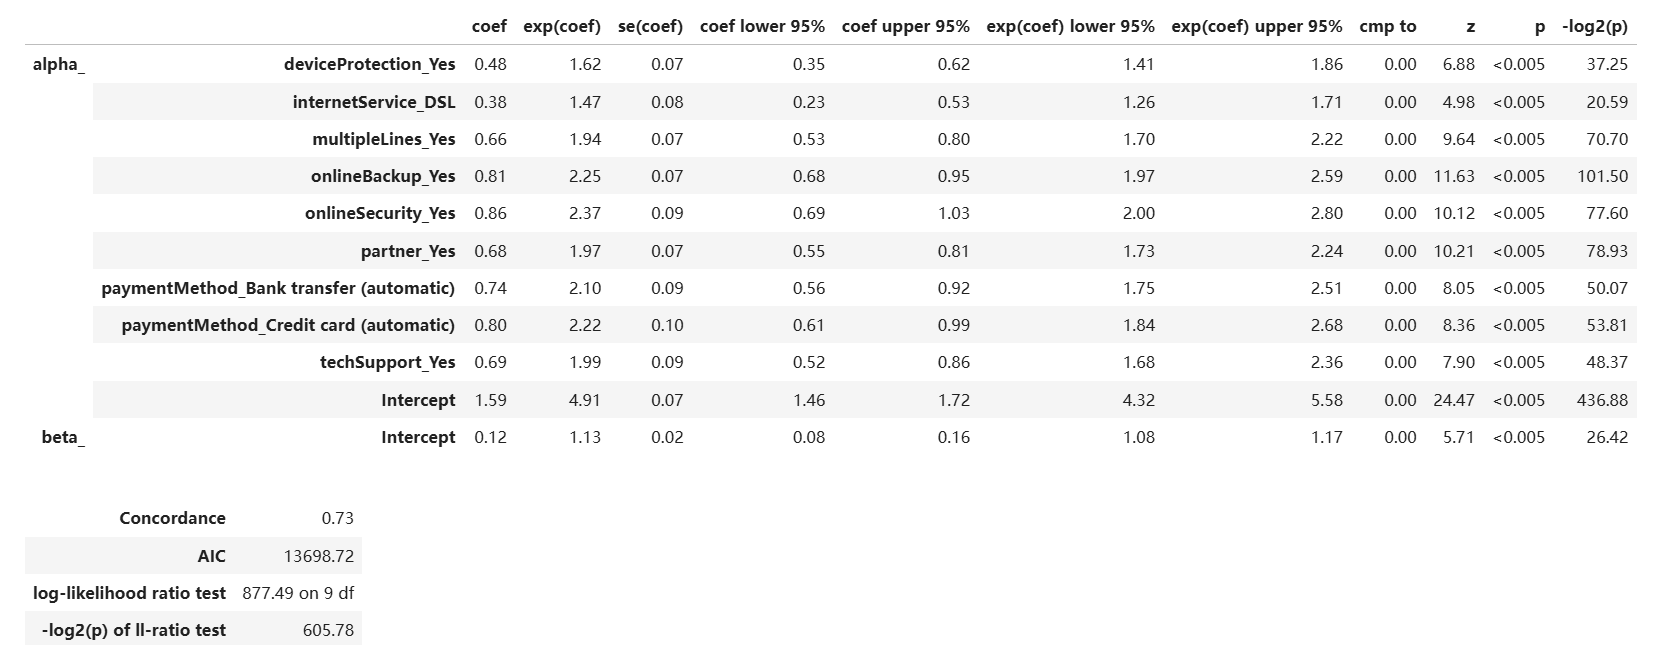
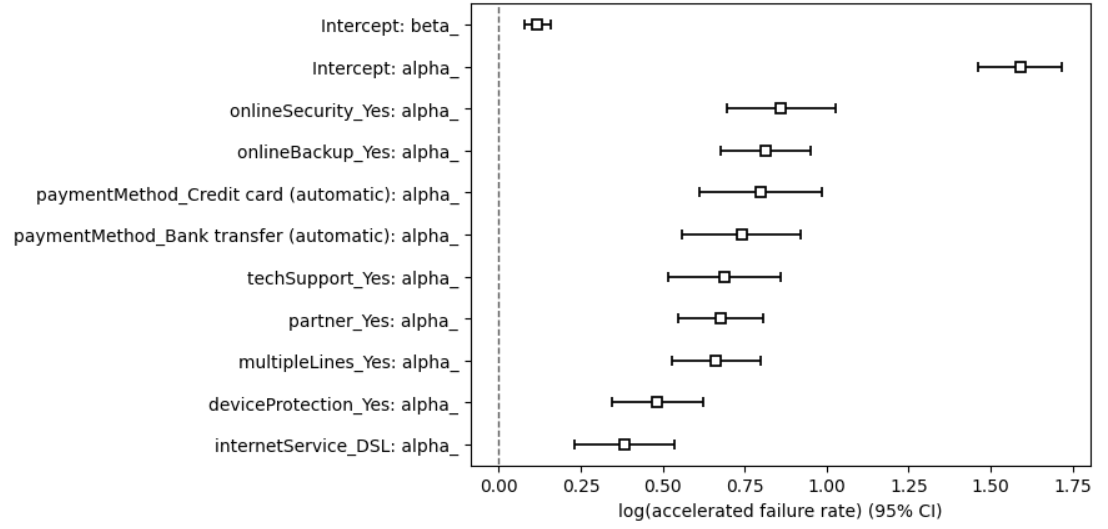
Model Summary:
| Variable | accelerated faliure rate | p-value | Interpretation |
|---|---|---|---|
deviceProtection_Yes |
0.48 < 1 | < 0.005 | Associated with reduced time of churn |
internetService_DSL |
0.38 < 1 | < 0.005 | Lower churn time compared to fiber users |
multipleLines_Yes |
0.66 < 1 | < 0.005 | Lower churn time compared to fiber users |
onlineBackup_Yes |
0.81 < 1 | < 0.005 | Reduced churn hazard |
onlineSecurity_Yes |
0.86 < 1 | < 0.005 | Reduced churn hazard |
partner_Yes |
0.68 < 1 | < 0.005 | Associated with reduced time of churn |
paymentMethod_Bank transfer (automatic) |
0.74 < 1 | < 0.005 | Associated with reduced time of churn |
paymentMethod_Credit card (automatic) |
0.80 < 1 | < 0.005 | Associated with reduced time of churn |
techSupport_Yes |
0.69 < 1 | < 0.005 | Associated with reduced time of churn |
Assumptions Checks: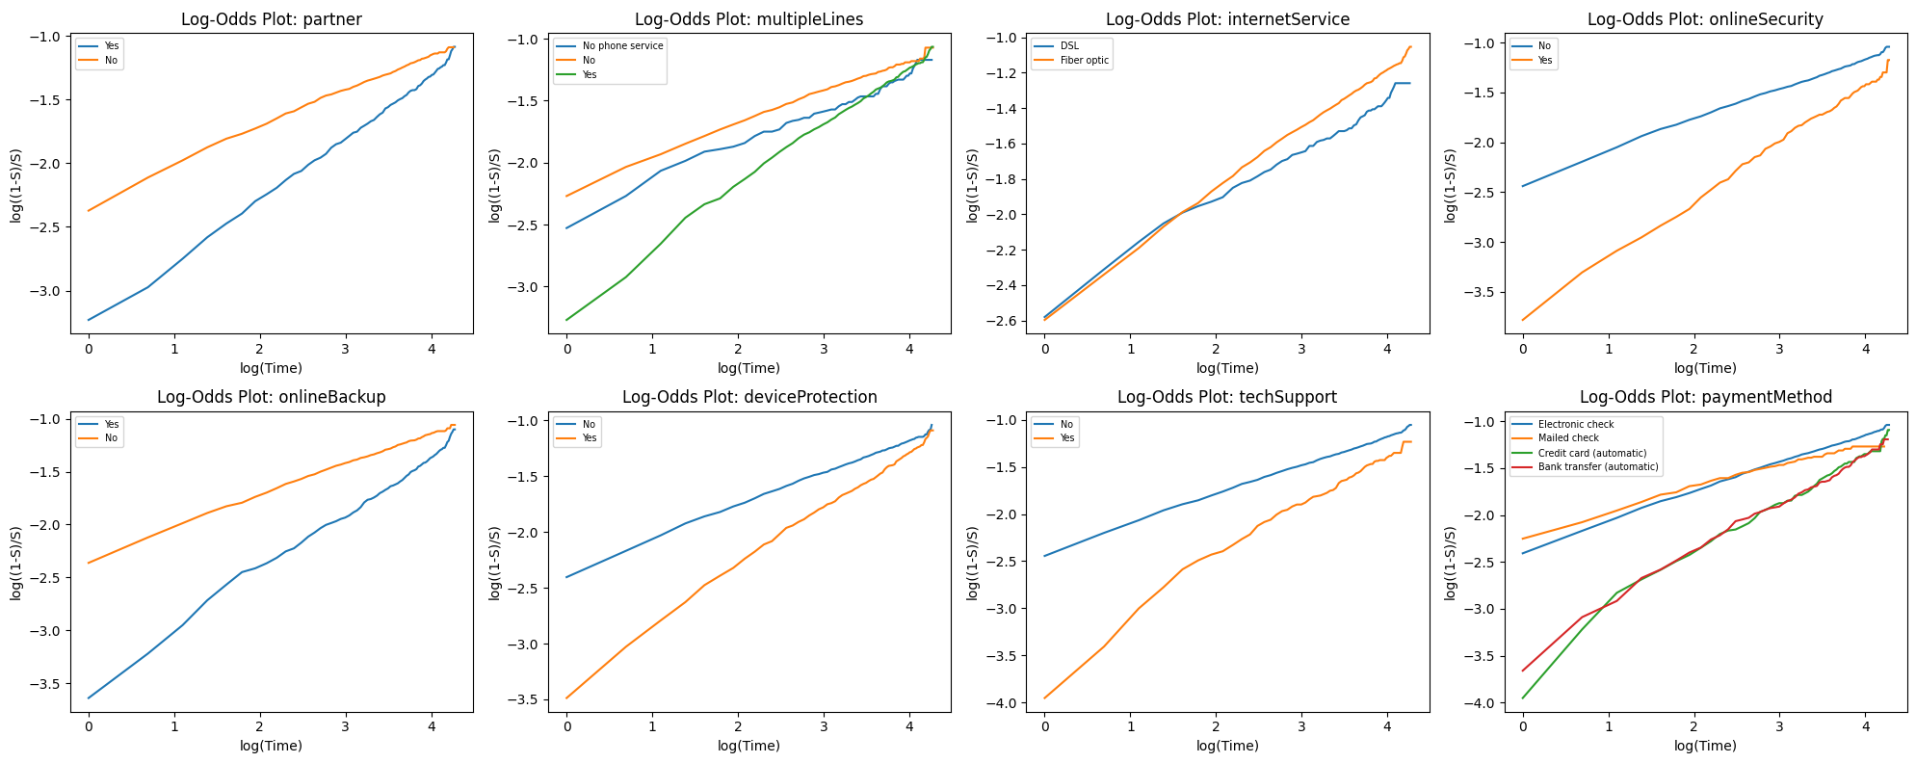
- First we check the
Proportional Oddsasumption. None of the plot is parallel, which means theProportional Oddsassumption is not satisfied. - Then we check the
Log-Logistic Distributionassumption. Variables likepartner,onlineSecurityanddeviceProtectionsatisfied the assumption becuase their plots are linear.